
Deze vertaling is in de maak. Voorlopig tonen we het Engelse origineel.
How to Read Candlestick Charts: The Trader's First Skill
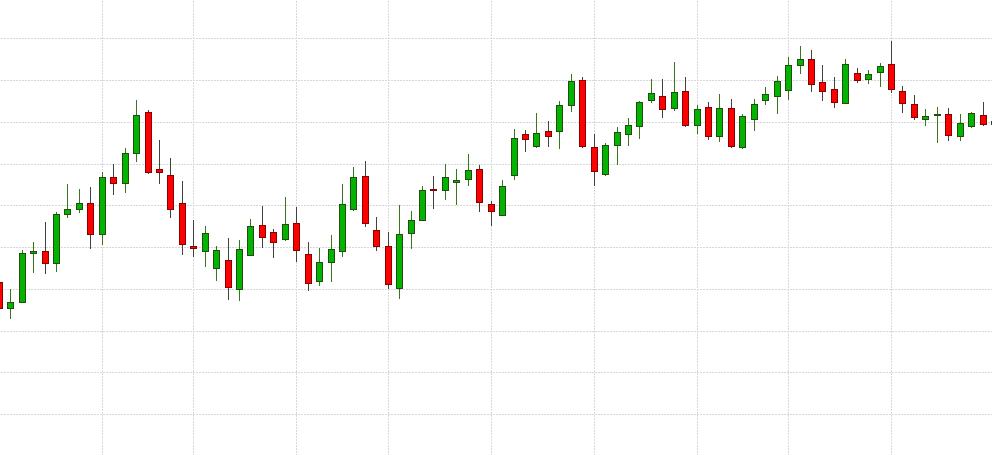
Candlesticks compress open, high, low and close into one visual unit. Learn to read individual candles, common patterns, and — more importantly — the context that gives them meaning.
Belangrijkste punten
- Each candle shows four prices: open, high, low and close for its time period.
- Body size shows conviction; wicks show rejection of price levels.
- Patterns like engulfing or pin bars only matter at meaningful levels.
- No pattern works reliably in isolation — context and confirmation are everything.
- Practice by annotating historical charts before trading patterns live.
What does a single candlestick tell you?
A candlestick summarizes trading over a fixed period. The body spans the open and close; the wicks (shadows) mark the high and low. A long body signals strong directional conviction, while long wicks reveal levels where price was pushed back.
Color convention is simple: a bullish candle closes above its open, a bearish candle closes below. On any timeframe — from one minute to one month — the anatomy is identical.
Which patterns should beginners learn first?
Start with three: the engulfing pattern (a body that fully covers the previous body, hinting at reversal), the pin bar (a long wick showing sharp rejection), and the doji (open and close nearly equal, signaling indecision).
The critical rule: a pattern only carries weight where it forms. A pin bar at a major support level after a decline is information; the same candle in the middle of a range is noise.
How do you trade candlesticks with context?
Combine candles with structure. Identify trend direction on a higher timeframe, mark support and resistance, then use candlestick signals on your trading timeframe as entry triggers — not as standalone predictions.
Always define the invalidation point first: the price at which the pattern has failed. That level sets your stop loss and, together with your target, the risk-reward ratio that decides whether the trade is worth taking.
Veelgestelde vragen
›Do candlestick patterns really work?
As standalone signals, poorly. As context-dependent triggers combined with structure and risk management, they are a useful timing tool. Backtest any pattern before trusting it.
›Which timeframe is best for beginners?
Higher timeframes (4-hour, daily) produce fewer but cleaner signals and give you time to think. Lower timeframes amplify noise and emotional pressure.
›What is the difference between candlestick and bar charts?
They show the same four prices. Candlesticks emphasize the open-close relationship with a colored body, which most traders find faster to read.
Bronnen en verwijzingen
Handelen in forex en CFD's met hefboom brengt een hoog risico op verlies met zich mee. Handel nooit met geld dat je niet kunt missen. Alleen educatieve inhoud — geen beleggingsadvies.
Lees verder
Trading Psychology: Why Good Plans Fail at the Worst Moment
Most trading failures are execution failures: the plan was fine, the human wasn't. Learn the biases that sabotage traders — loss aversion, revenge trading, overconfidence — and the systems that neutralize them.
Advertentie
Advertentie
Advertentie